
18 de abril de 2020
26 de novembro de 2019
 Gráficos para todos os gostos

Aceder aqui para ver a descrição de variadíssimos tipos de gráficos e para alguns conselhos na sua elaboração.
23 de março de 2019
Como ler um gráfico - Versão Trump
Trump brandishes yet another graph, but says, "You do not have to know what the hell is on it. All you know is, that's a good line." pic.twitter.com/AgA5p0jZJ2— Aaron Rupar (@atrupar) 20 de março de 2019
16 de setembro de 2017

6 de novembro de 2014
8 de setembro de 2011
Estatísticas e mapas simples para a sala de aula
 Um conjunto muito restrito mas essencial de dados estatísticos, com mapas e gráficos de acesso muito simplificado, para utilizar na sala de aula ou pelos alunos em trabalhos de Geografia. Em Worldstat.
3 de setembro de 2011
Recursos Gapminder


 Para visualização de gráficos, há um "novo" recurso intitulado "Gapminder Agriculture", o qual reune cerca de 700 indicadores sobre o tema para serem visualizados e correlacionados entre si.
28 de março de 2011
Crie gráficos interactivos e dinâmicos
 PRISM é uma plataforma de informação estatística da região do Pacífico que dispõe de uma aplicação online de grande utilidade para o professor de Geografia que se interessa pela utilização das TIC na sala de aula.
 Essa aplicação dá pelo nome de "Excel to Times-Series Tool" e permite ao utilizador criar o seu próprio gráfico, interactivo (em Flash), à boa maneira do Gapminder, a partir de um ficheiro Excel. São apenas 3 passos bastante simples:
 Depois de clicar no link gerado, abre-se uma página com o gráfico obtido a partir dos dados carregados. De cada vez que se pretender carregar novos dados ou alterar os actuais, será necessário repetir todo o processo.
24 de março de 2011
Se eu vivesse em ...
 Comparar países à escolha do utilizador é a grande utilidade deste sítio intitulado If It Were My Home, que, mediante a escolha de dois países, permite simular (em termos de alguns indicadores) como seria a vida num país em comparação com o de residência do utilizador, por exemplo. No exemplo em baixo, comparou-se Portugal com o Mali, sendo o resultado do tipo "se vivesse no Mali: usaria menos 99% de electricidade, teria 3,3 vezes mais probabilidade de estar desempregado, haveria 24,1 vezes mais probabilidade de morrer na infância, para além de outros.
 Neste sítio é ainda possível comparar a área dos países, através da sobreposição dos mesmos, conforme se mostra.
23 de fevereiro de 2011
25 de janeiro de 2011
População urbana no Brasil

Interactiva porque ao passar com o cursor por cima de cada círculo, obtém-se o nome da cidade, a sua população e a distância em relação à capital estadual.
18 de janeiro de 2011
Segurança alimentar e alterações climáticas

and climate change to 2050"
Mais aqui, ou aqui para download do relatório. Um recurso bastante útil é o Mapa mapa interactivo com inúmeros indicadores demográficos, económicos e sociais. Tremendamente útil.
25 de novembro de 2010

18 de novembro de 2010

9 de outubro de 2010
As línguas mais faladas no Mundo vão de metro?
 Trata-se de um recurso infográfico de marketing, de uma empresa de serviços de tradução (PSTranslation.co.uk) e a fonte dos dados não é indicada. Clicar aqui para obter poster A3.
24 de setembro de 2010
Desenvolvimento interactivo
 "Os melhores países do Mundo" é um recurso interactivo muito útil para o tema "Contrastes de Desenvolvimento", produzido pela Newsweek. Trata-se de um recurso gráfico que nos permite comparar a "posição" de cada país com outros, no que respeita a indicadores económicos, de saúde, demográficos, entre outros. A selecção pode ser feita por país, por região ou grupo económico (G7, G20, UE). Aqui.
14 de setembro de 2010

4 de junho de 2010

7 de maio de 2010
Gráficos do melhor que há por aí
 (Muitos) Gráficos e mapas simplesmente ....... úteis. A descobrir aqui. Começando pelo World Development Indicators ou pelo OECD Factbook 2009. Configuráveis. Altamente recomendáveis para explorar na sala de aula, recorrendo aos projectores / quadros interactivos (desde que o professor de Geografia não seja contratado(*)).
(*) - Há uns meses atrás, uma colega de Geografia contava-me que na sua Escola os computadores portáteis não podiam ser requisitados por professores contratados!!!!! Só visto!!!!!
2 de abril de 2010
Mais gráficos e mapas Earth Trends
| On average, U.S. steel production is among the least carbon-intensive in the world. This is primarily the result of the type of production process the industry employs. Nearly half of all steel in the United States is made in "mini mills," which use electricity to recycle scrap steel rather than starting from scratch by burning coal and coke to melt iron ore into iron. The electric arc furnaces employed by the mini mills emit one-fourth the amount of CO2 per ton of steel as the blast furnaces and basic oxygen furnaces used in integrated mills if only direct emissions from the factory are counted. If one includes the CO2 emitted to produce the electricity an electric arc furnace consumes, the embedded carbon increases (though still less than that from an integrated mill, especially if that electricity is generated from low-carbon fuel sources). | 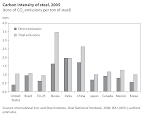 Download Figure | Data and Citation |
| GHG emissions associated with manufacturing and construction industries represent approximately one-fifth of global greenhouse gas emissions. This chart shows industry-related CO2 emissions of the 25 top emitting countries (including the EU-27), in both absolute and per capita terms. Together, these countries account for 84 percent of global emissions from this sector. | 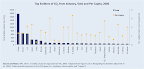 Download Figure | Data and Citation |
| One option for containing costs for carbon-intensive manufacturing industries in climate legislation is to exclude them altogether from the list of regulated entities. At less than 6 percent of total U.S. emissions, carving out this sector of the economy may seem like an acceptable sacrifice if it alleviates enough concern about industrial competitiveness to win support for broader climate legislation. However, carveouts in U.S. policy create incentives for major trading partners to follow suit. While only 11 percent of the U.S. total, direct emissions from manufacturing account for 31 percent of all emissions in China. If indirect emissions are included, manufacturing accounts for two-thirds of the CO2 China emits. Therefore, if carveouts are selected as a policy option, then an alternative regime, such as an international sectoral agreement, should cover industries excluded from a domestic cap-and-trade or carbon tax system, rather than exempting them altogether. | 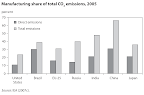 Download Figure | Data and Citation |
| In 2008, China's National Development and Reform Commission adopted a standard requiring all new coal-fired power plants to be state-of-the-art commercially available or better technology. As a result, today most of the world's most efficient (supercritical and ultra-supercritical) coal-fired power plants are being built in China. | 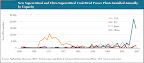 Download Figure | Data and Citation |
| Nearly 40 billion gallons are withdrawn each day from Southeast freshwater supplies for thermoelectric power plants (about 65 percent of all withdrawals). To put this in perspective, this is nearly equal to the total daily freshwater withdrawals for public supply across the entire United States. This water is needed for cooling purposes at power plants that use coal, oil, gas, nuclear, or biomass fuels to generate heat and produce electricity. Depending on the cooling methods, a portion of this water is consumed (lost to the atmosphere through evaporation). Over the course of a year, thermoelectric power plants in the Southeast consume nearly 140 billion gallons as a result of evaporation losses—equal to the annual water use of more than 1 million homes. | 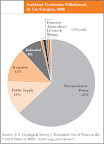 Download Figure | Data and Citation |